Reduce MPLS troubleshooting from days or weeks to minutes or hours
23 Mar

NetSpyGlass’s automatic detection of MPLS links and real-time monitoring of LSPs enables you to see changes in your network graphically, as they happen.
MPLS is a scalable solution that delivers better performance, lower network congestion, and can often provide a better end user experience. The design allows the network traffic engineers to designate primary and backup label-switched paths (LSPs), and to categorize traffic by priority, which is great for latency or jitter sensitive applications.
In an MPLS deployment the optimal LSP is designated at the headend by traffic engineering to ensure that traffic takes the optimal path among the many paths that exist to get from point A in a network to point B. In a situation where a link in an LSP fails, sending the “what’s next” decision back to the headend can cause unacceptable delay. Instead, MPLS’s Fast Reroute provides link protection by enabling traffic to be rerouted around the segment where the failure occurred. The decision to reroute is made locally by the router interfacing with the failed link and eliminates packet loss while the headend recovers to establish a new path. It is important to note, however, that the technology does so without knowledge of how much of the bandwidth is actually available on that second route. When high priority traffic takes over what used to be a backup LSP, it is combined with traffic that is already transiting that path. The result is oversubscription. This can be the beginning of a domino effect throughout the network because Fast Reroute is designed to handle actual link failures, not oversubscription. A similar situation can occur when there are unexpected traffic spikes.
Many times the troubleshooting of such events doesn’t start until the event is already long over. In the past, looking for an issue in an MPLS network often required hours or days of combing through logs in the Command Line Interface (CLI) trying to track each one of often hundreds of LSPs. This means that when you find the event, you will probably also find many individual files that you will need to crawl through to expose the situations that started the cascade. Most organizations reliant on MPLS have tried to create scripts to look at events over time, sometimes querying back to their Security Information and Event Management (SIEM), to help make sense of the chaos but even that takes time. And in the end you are left trying to map router IP addresses together just to get a picture of your network.
If any of these challenges sound familiar, NetSpyGlass has the answer you’ve been looking for (and no, it’s not in the CLI).
When you deploy NSG to handle network monitoring, it automatically detects details of MPLS LSPs, including the path name, start and finish node names/IP addresses, and more, then puts the data into a graphical map display. You can then easily visualize the tunnels throughout your network.
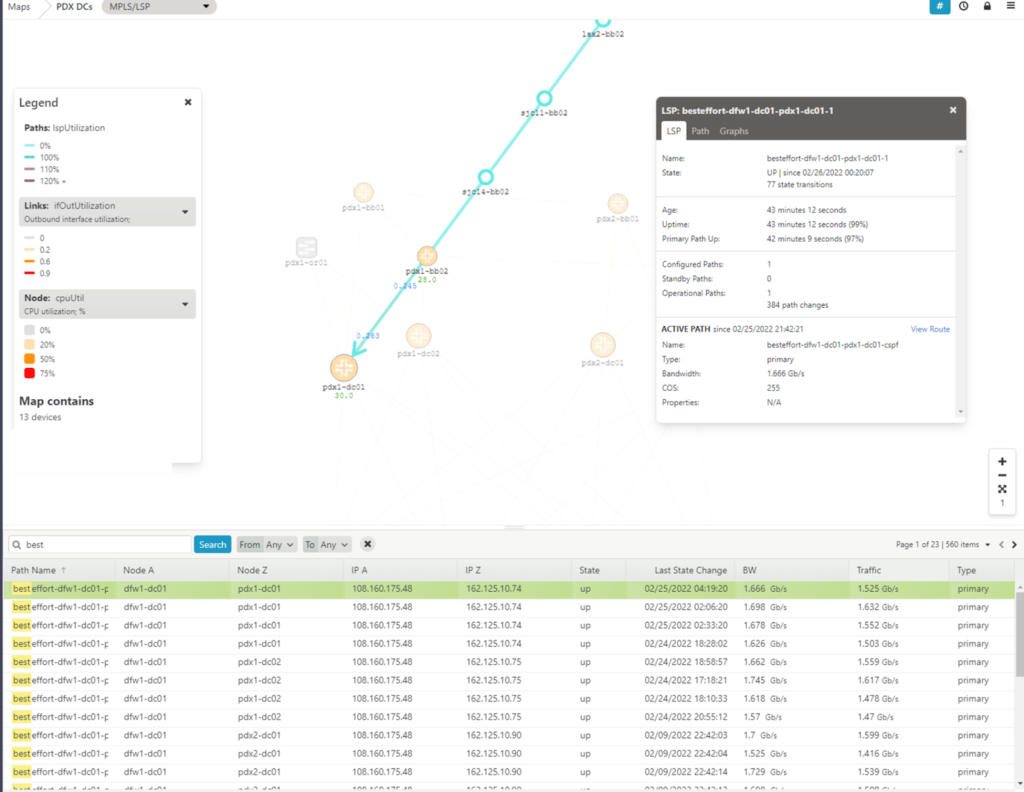
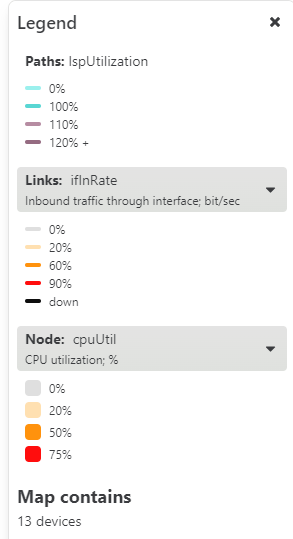
The LSPs on the map are drawn in the context of the physical network links of the route, and are presented in the color corresponding to the level of traffic crossing the physical link, as well as the route itself.
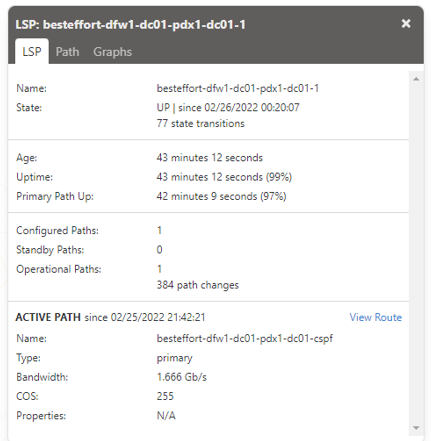
By clicking on the path, you can get additional details about the LSP including IP address and device names, how many state transitions have occurred, how long the tunnel has been up, how many times the path has changed, the bandwidth reservation and the actual traffic. By looking at the graphs tab associated with the path, you can even see a graphical representation of traffic volume over time.
If you’re trying to research an issue that has already happened, you can simply use NSG’s Historical Maps feature. After you select the path that you want to consider in the table, and the map appears, just click on the clock icon in the upper right corner, and select the dates and times that you are interested in. You are not limited to considering only a single path; you can select multiple paths and see how/if they interact with each other.
Finally, it is important to also remember that, like everything in NetSpyGlass, LSP links can be considered as variables. These variables can be combined to create meaningful alerts that will let you know about issues with LSPs before they become a problem. A simple alert could be based on the variable that tracks the time that has elapsed since the last LSP path change. Here is an example:
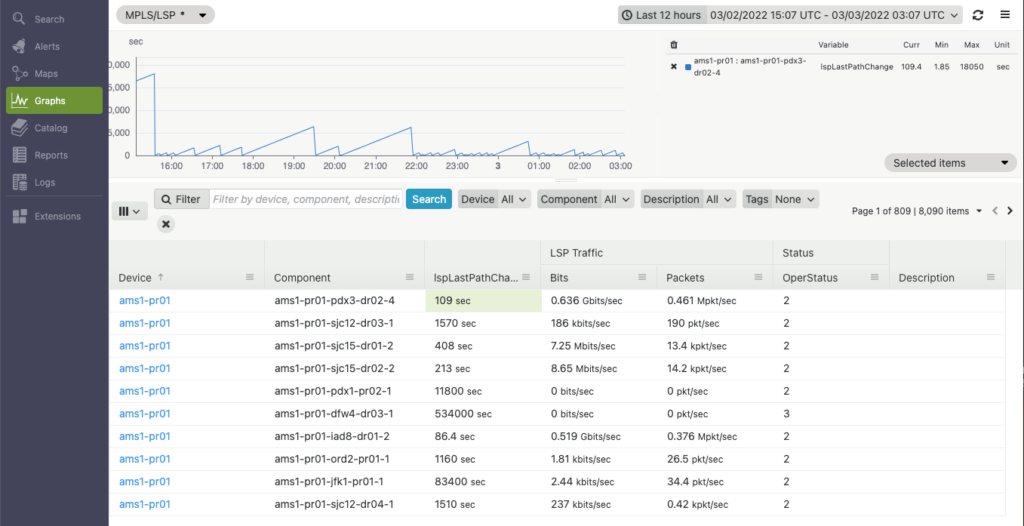
The graph clearly shows that tunnel ams1-pr01-pdx3-dr02-4 appears to be unstable, as it changes path quite often. We could build an alert to monitor this variable and notify us whenever a tunnel gets rerouted too often:
# noinspection PyUnresolvedReferences
from nw2functions import alert, query
def alert_lsp_unstable(log):
“””
this alert activates when it finds an LSP with uptime that
never exceeds 5 min in a consecutive 30 min interval. This
means the LSP constantly reroutes
Note that the value of variable `lspLastPathChange` is in seconds
“””
alert(
name=“alert_lsp_unstable”,
input=query(“FROM lspLastPathChange WHERE NSGMonitor=ALERTED”),
condition=lambda mvar, value: value <= 300,
description=“LSP reroutes often: path uptime is constantly under 5 min for the last 30 min”,
duration=1800,
percent_duration=100,
notification_time=3600,
streams=[“log”],
fan_out=True,
)
Here is how this alert looks in NetSpyGlass “Alerts” panel:
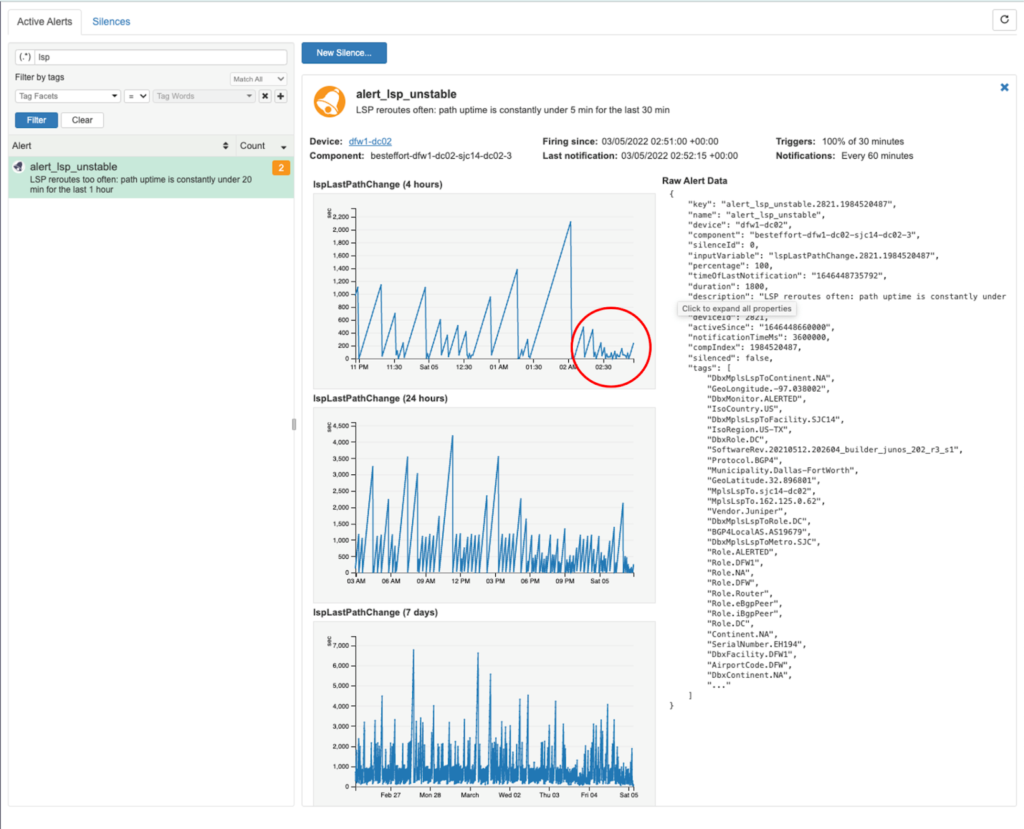
As you can see, the alert shows a high incidence of “link flapping” within the specified time period, which could be indicative of some sort of anomaly.
Copyright © 2024. All right reserved.